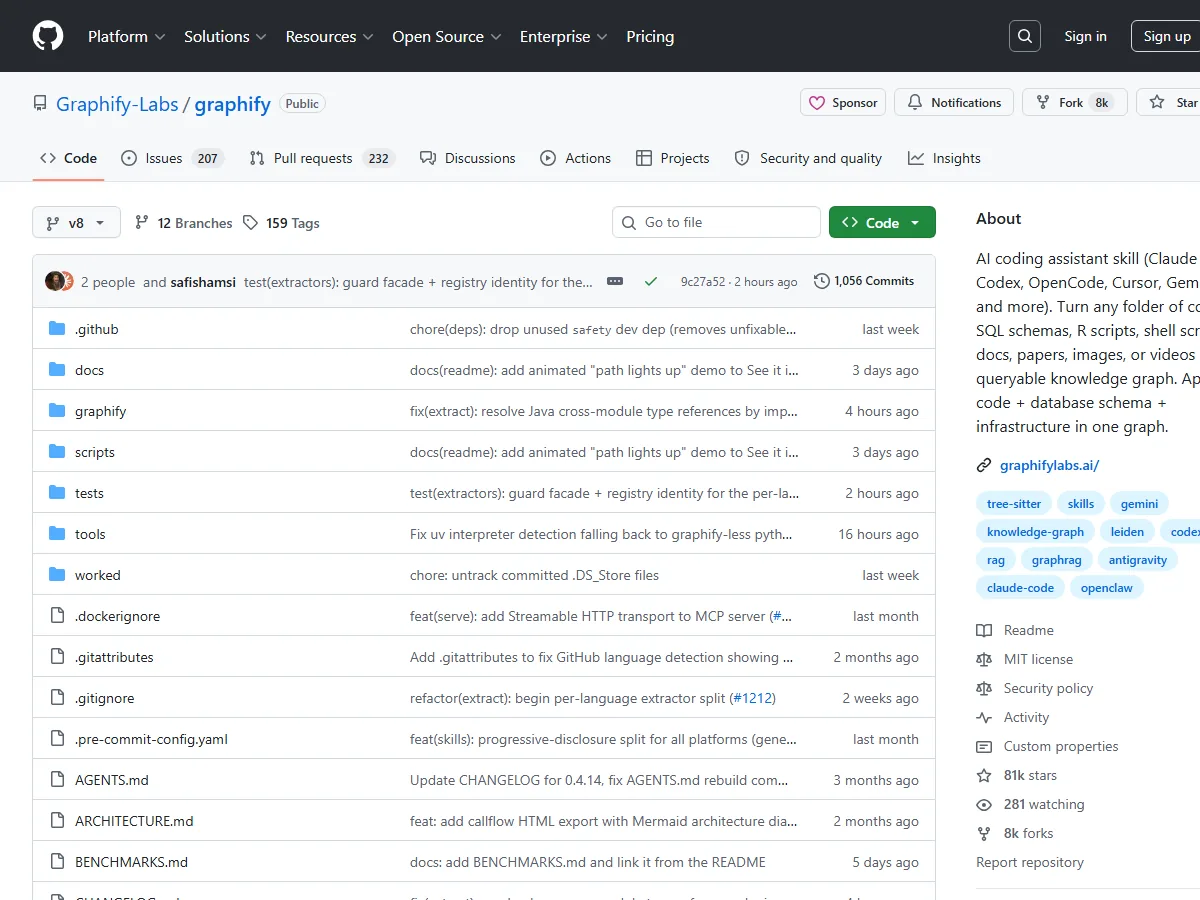
Graphify is not another RAG tool for code. It builds a real, traversable knowledge graph from your entire project — code, SQL schemas, docs, PDFs, even videos — without sending your code to any API. And it works with every major AI coding assistant out there.
Why Grep Finally Feels Like a Stone Age Tool
Let me tell you something that happened last month. I was dropped into a medium-sized Python monorepo — about 150 files, a mix of FastAPI endpoints, some Celery workers, and a handful of SQLAlchemy models that had grown tentacles into every corner of the codebase. My normal workflow? grep -r for every class name, then mentally reconstructing the call chain. An hour later I’d have a fuzzy picture. The next day? Almost gone from my head.
This is the reality for anyone who inherits a codebase, returns to a project after six months, or works on a team where the architecture is more “organically evolved” than deliberately designed.
We’ve been told that AI assistants will fix this. And they do help. But the typical AI coding assistant — Claude Code, Cursor, Gemini CLI — suffers from a fundamental blind spot: it sees your project as a flat bag of files. It can read, but it can’t map.
Enter Graphify.
Not a Vector Index — a Real Graph
Here’s where Graphify breaks from the herd. Most “code understanding” tools shove everything into a vector store and call it a day. Embeddings, HNSW indexes, similarity search. It works for chat. But it’s terrible for reasoning about structure.
Graphify doesn’t do that. It builds a proper knowledge graph — nodes are concepts (classes, functions, modules, docs, even image captions), edges are relationships (calls, imports, inherits, mixes_in, references). The whole thing is traversable. You can ask “what connects UserService to DatabasePool?” and get a precise path, not a list of vaguely similar chunks.
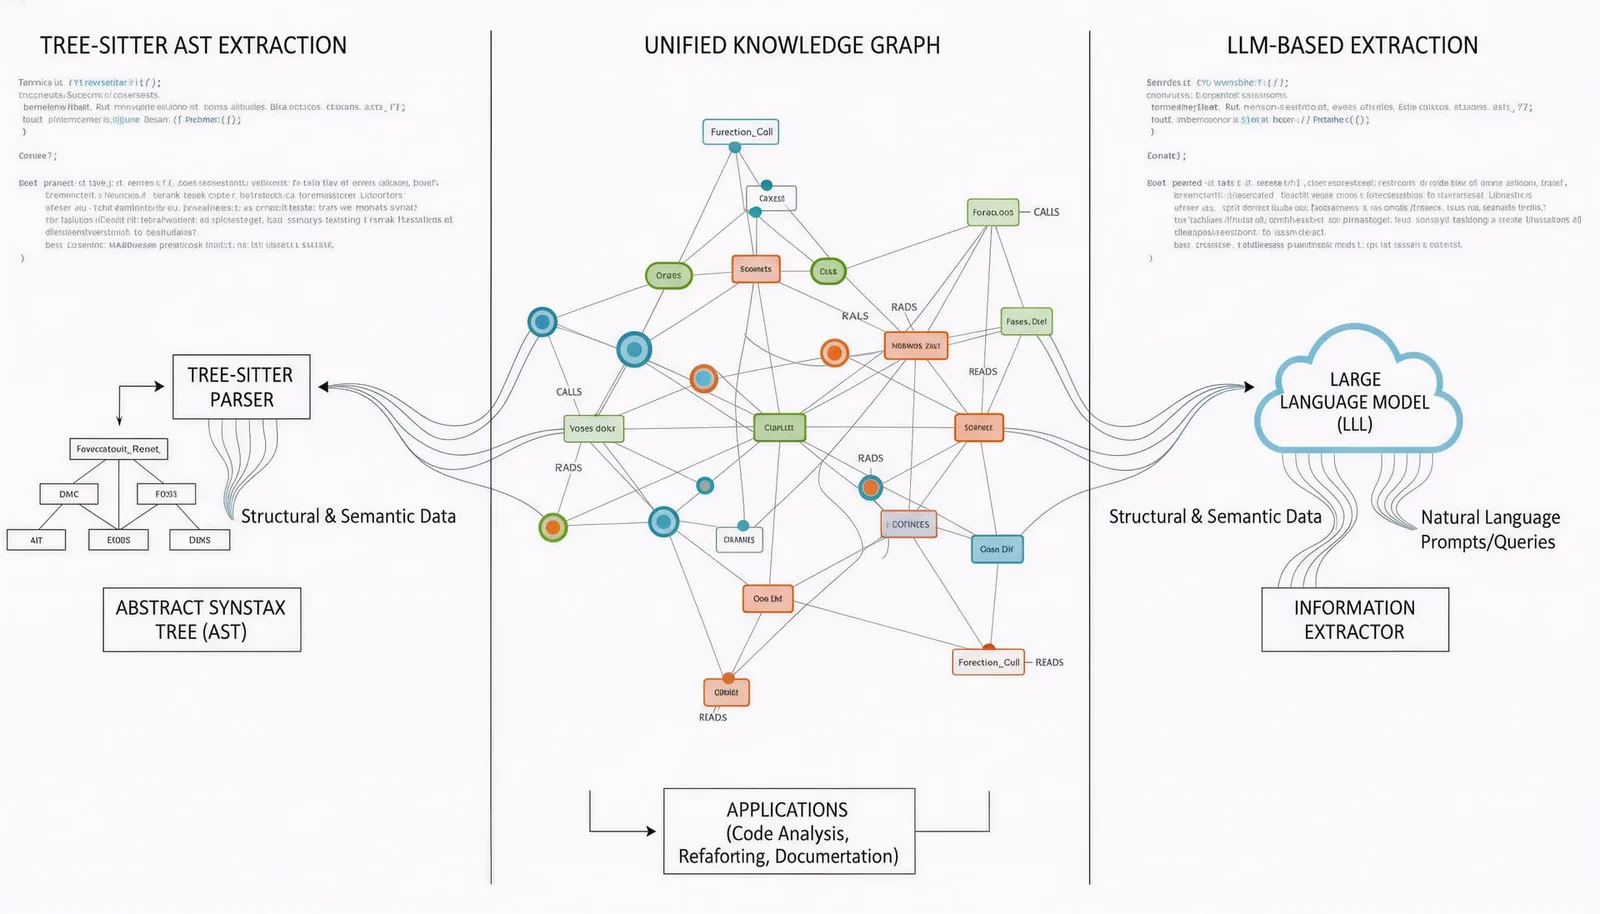
The kicker? Code parsing happens entirely locally via tree-sitter ASTs. No LLM, no network calls, no data leaving your machine. For code, it’s deterministic. Every import, every class, every function gets extracted with zero hallucination risk. That’s rare. Most other tools rely on an LLM to parse code, which is both expensive and unpredictable.
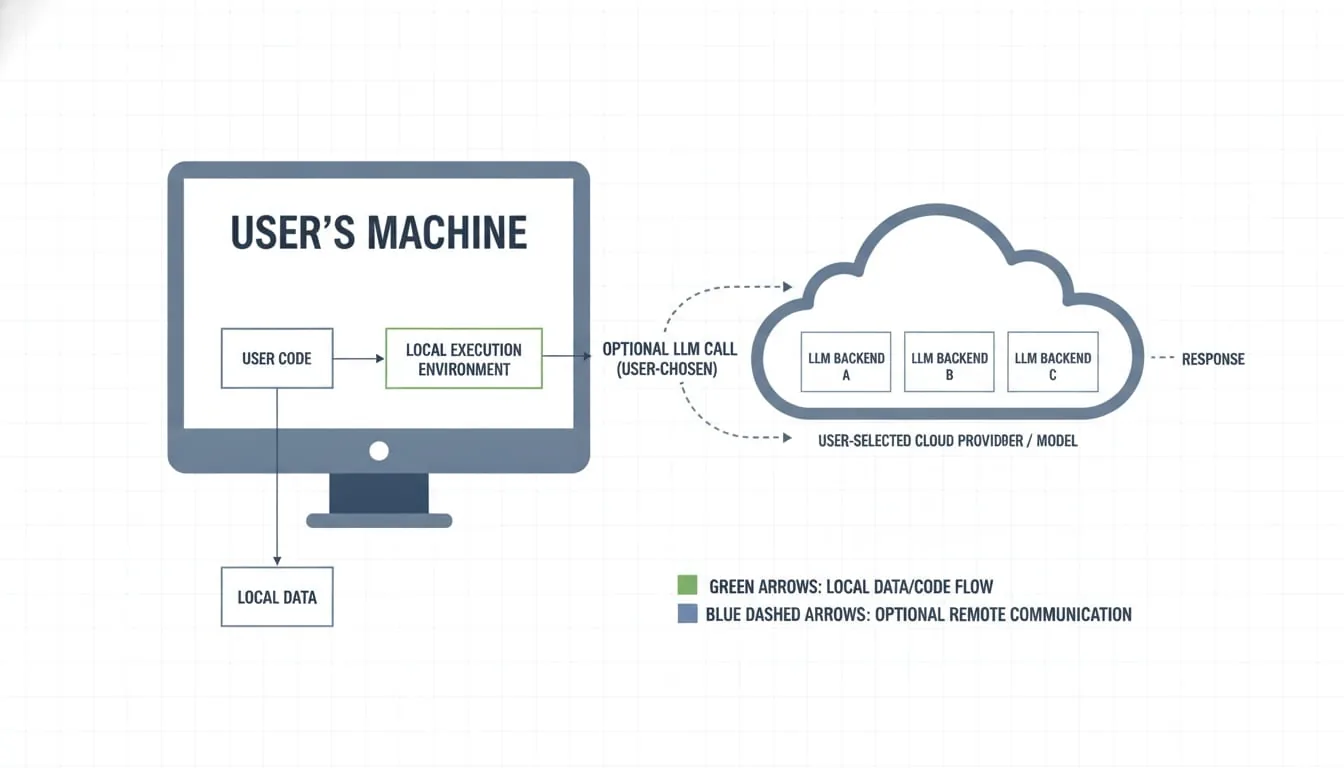
Docs, PDFs, images, and video do use an LLM for semantic extraction — but only if you configure a backend. And you can use any model provider via the configured API key, or run a local model. Your call.
30 Seconds to a Working Knowledge Graph
Here’s the part I love: the friction is almost zero.
uv tool install graphifyy
graphify install
Open your AI assistant. Type /graphify .
Done. In seconds you get three files in graphify-out/:
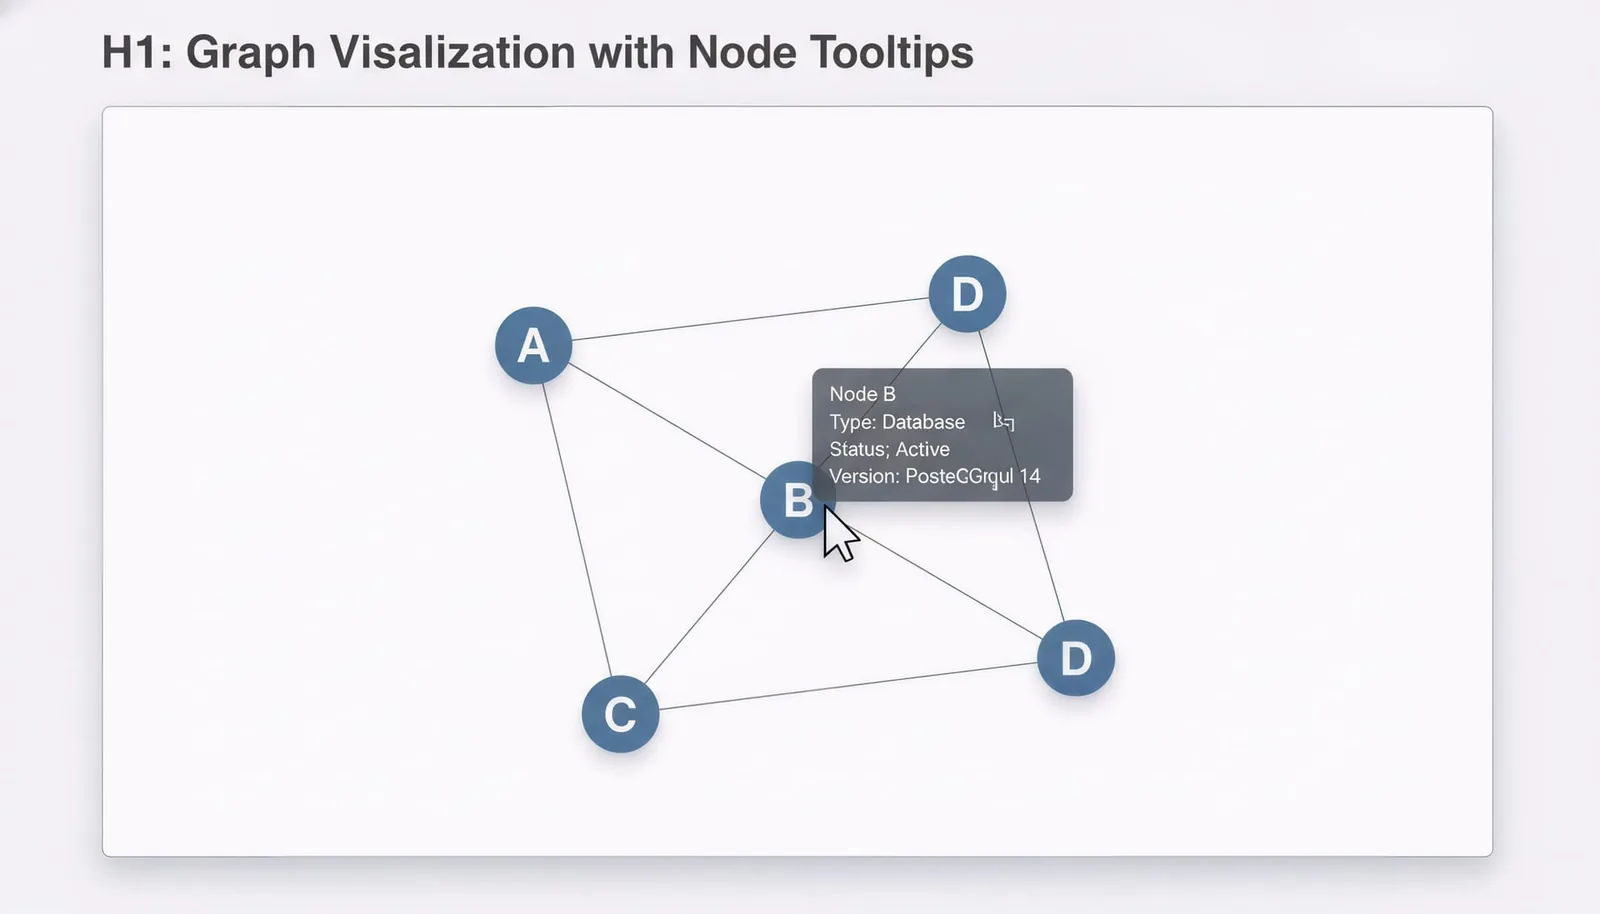
- graph.html — an interactive visualization you can open in any browser. Click nodes, filter by community, search by name.
- GRAPH_REPORT.md — a readable summary: god nodes (the most-connected concepts), surprising connections, suggested questions.
- graph.json — the full graph, queryable anytime without re-reading files.
There’s no building a custom schema. No setting up a vector database. No writing embedding pipelines. It just works.
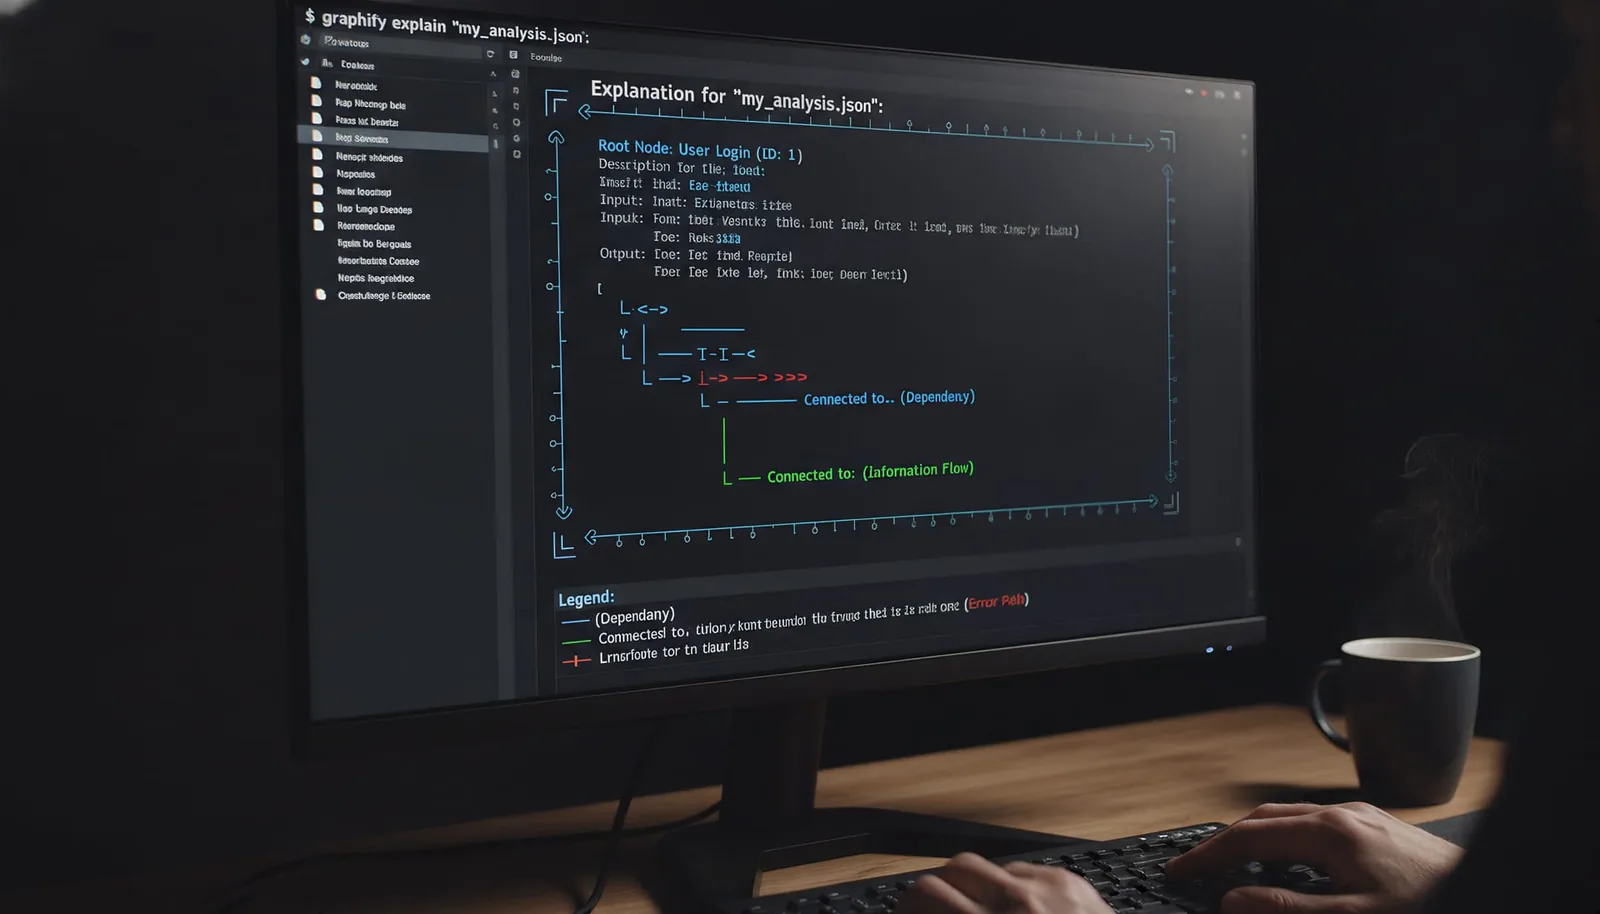
I tested this on the FastAPI codebase itself. graphify explain "APIRouter" returned a node with 47 connections, each tagged EXTRACTED (explicit from source) or INFERRED (resolved by graphify). You always know what was read vs guessed. That transparency matters more than most people realize.
Works With Every Assistant You Already Use
Graphify isn’t tied to one editor or one AI platform. The project lists support for over 20 assistants — Claude Code, Cursor, Codex, Gemini CLI, GitHub Copilot, Aider, Kimi Code, even Devin CLI. The install command varies slightly per platform (graphify cursor install, graphify install --platform gemini), but the skill itself is the same.
Why does this matter? Because the AI assistant ecosystem is fragmented. You might use Cursor for side projects and Claude Code at work. Or you might be evaluating Codex vs Kilo Code. Graphify follows you. One knowledge graph, many entry points.
I’ve personally used it with both Claude Code and Gemini CLI on the same project — the graph is just files in your repo. It doesn’t care which assistant you’re running.
Beyond Code: Docs, PDFs, Images, Videos
This is where Graphify surprised me. Most code analysis tools stop at source files. Graphify ingests Markdown, HTML, PDFs, .docx, .xlsx, images (extracts captions/metadata), and even video (transcribes via faster-whisper, local). All of it lands in the same graph.
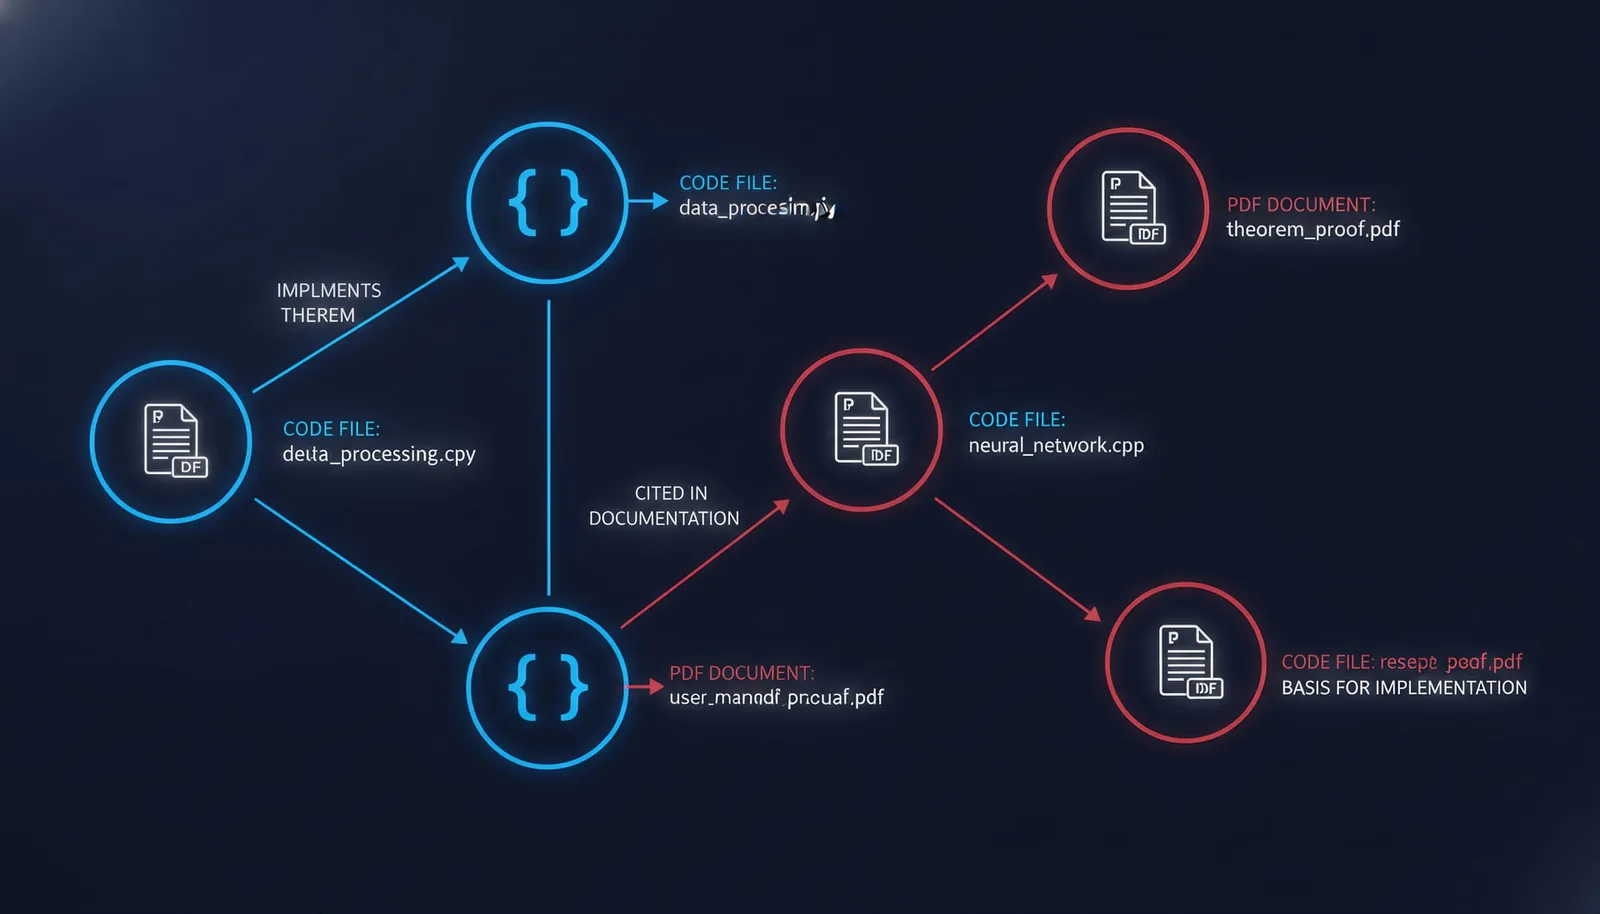
Imagine pointing /graphify . at a research project — code in one folder, a PDF of the paper in another, a few schematic diagrams. The graph connects the PDF’s methodology section to the implementation class. It links an architecture diagram to the module that implements it. That’s not a vector lookup; that’s a real, human-readable map.
One use case I hadn’t considered: adding a research paper or documentation to an existing graph. Graphify automatically picks up PDFs and other supported files and links them into your graph as nodes. Suddenly your codebase has a direct edge to the documents that inspired it. That’s gorgeous.
The Output: Three Files That Change How Your Team Works
I mentioned graph.html and graph.json, but let’s zoom in on GRAPH_REPORT.md. It’s a generated document that reads like a senior engineer’s onboarding notes. It surfaces:
- God nodes — the most-connected concepts. In a complex project, you see up to a dozen concepts that everything flows through. Instantly know where to focus.
- Surprising connections — edges between files in different modules that aren’t obvious from imports, helping you discover hidden relationships in your codebase.
- The “why” — inline comments (
# NOTE:,# WHY:,# HACK:) become first-class nodes linked to the code they explain. Architectural decision records (ADRs) are extracted as separate nodes. This is huge for institutional memory. - Suggested questions — a set of questions the graph is uniquely positioned to answer. A conversation starter for new team members.
The graph also performs community detection using the Leiden algorithm (no LLM needed, though you can optionally use an LLM to label communities). The graph.html visualization color-codes each community. You can see at a glance which parts of your codebase form natural subsystems.
Query It Like a Database
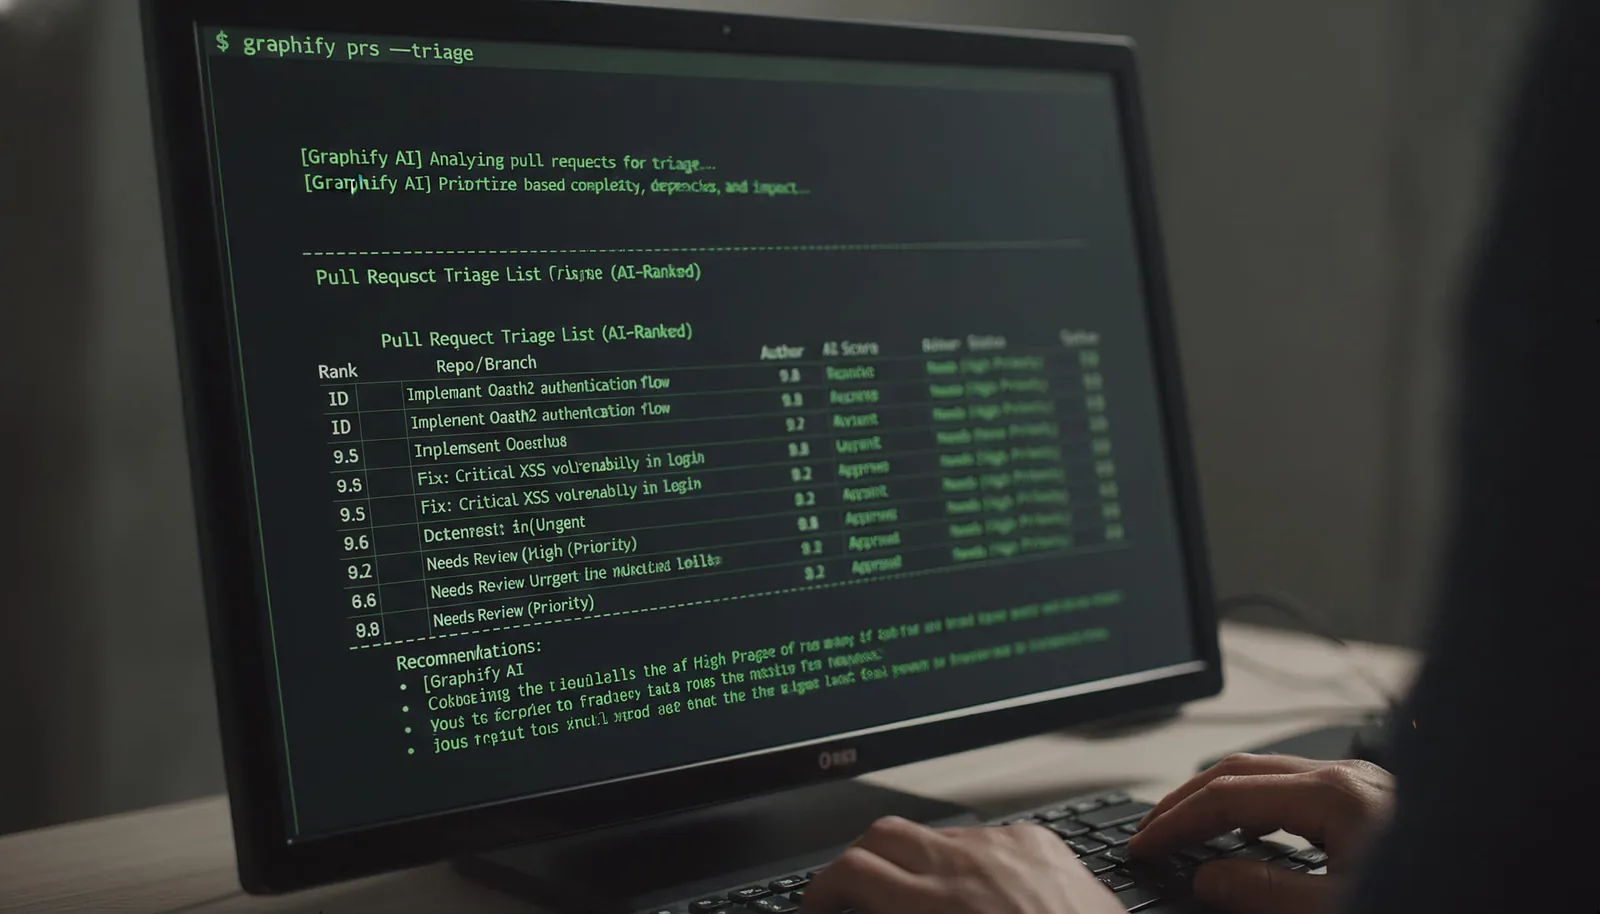
Once the graph is built, you don’t have to open the HTML report every time. Graphify provides three core commands from the terminal:
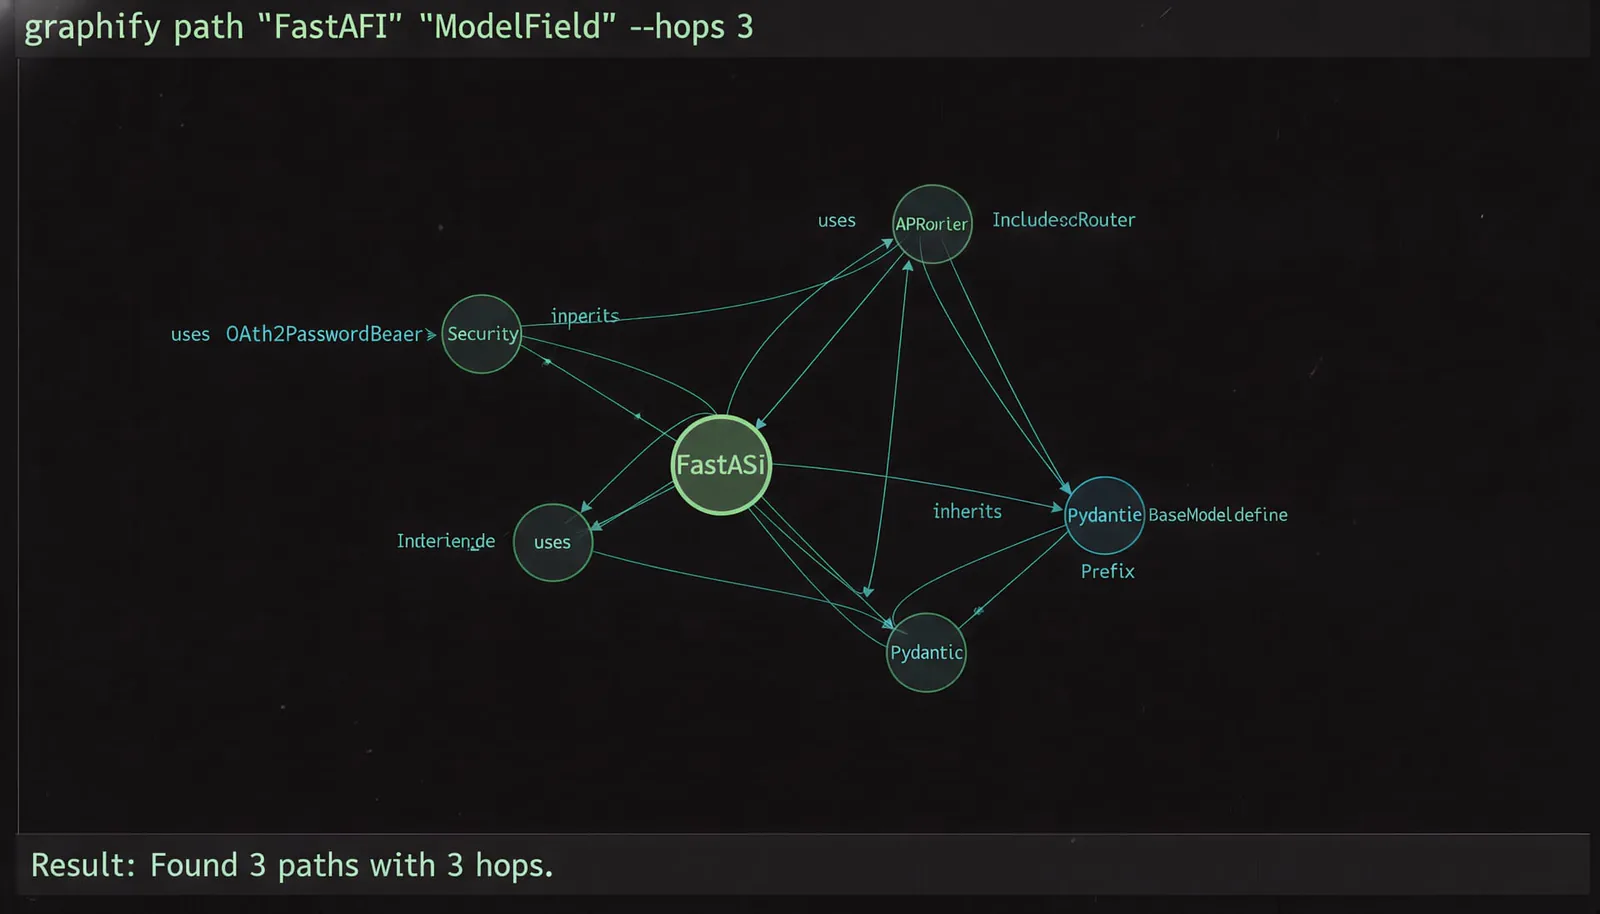
graphify query "<question>"— returns a scoped subgraph relevant to a plain-language question.graphify path "Foo" "Bar"— finds the shortest path (hops) between two entities.graphify explain "RateLimiter"— shows all connections to a specific node, with confidence tags.
You can also expose the graph via an MCP server (part of the mcp extra) so your assistant can query it directly through MCP tool calls. No more reading 50 files to understand one function call.
I’ve been running the MCP server as a background process in my dev environment. The assistant now asks the graph before grepping. It’s faster, more accurate, and doesn’t waste my API budget.
Built for Teams, Not Just Solo Devs
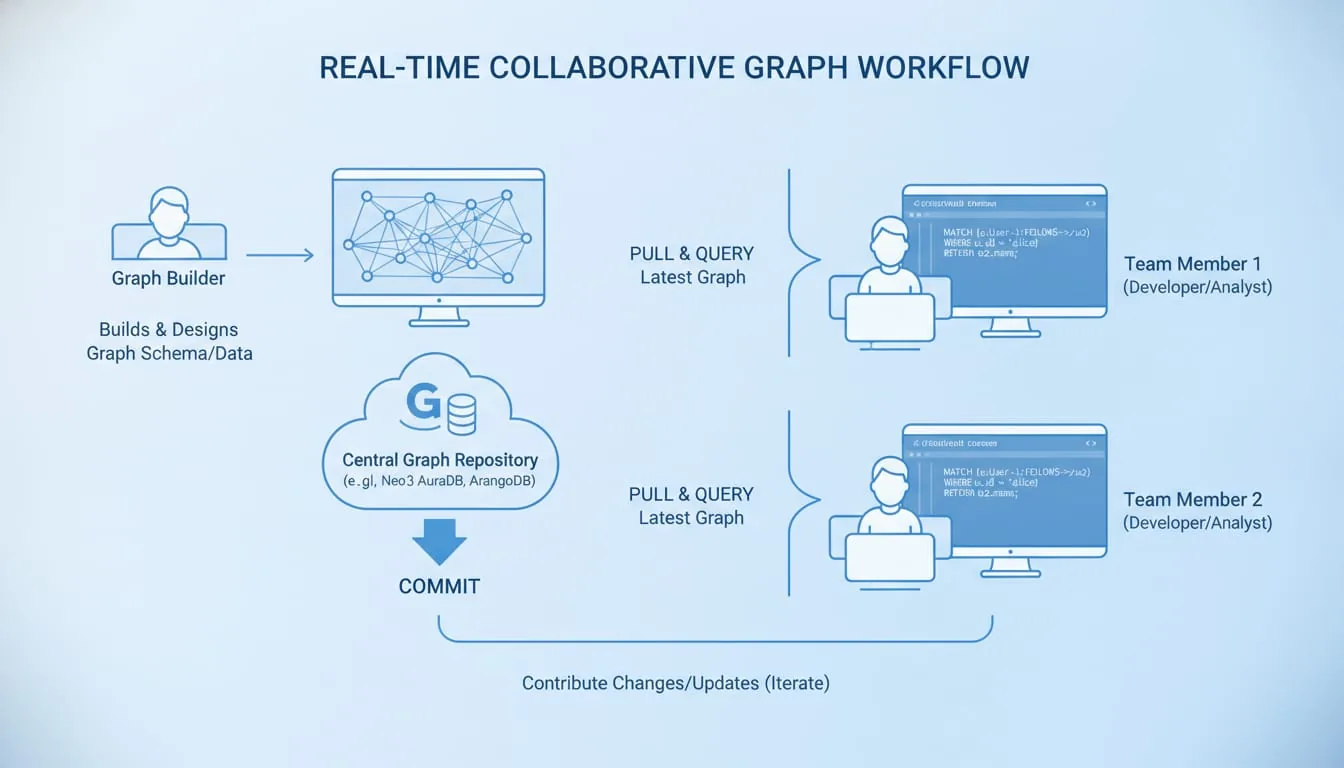
You could keep graphify-out/ in .gitignore and rebuild locally every time. But committing it has advantages. Here’s why:
One person runs /graphify . and checks in graphify-out/. Everyone who pulls gets the full graph immediately — no rebuild needed. The graphify hook install command adds a post-commit hook to keep the graph in sync with your code. Docs or papers changed? Re-run graphify to refresh your graph.
This is a team-first design. In my experience, the hardest part of onboarding is getting the lay of the land. Graphify turns that from a week of “just ask around” into a few minutes of clicking through a graph.
Privacy First, No Exceptions
I’m not naive about privacy. Most cloud code understanding tools send your source code to an external API the moment you type a question. Graphify doesn’t. Code is parsed via tree-sitter locally. Nothing leaves your machine. Only docs, PDFs, images, and video (if you choose to include them) go through an LLM backend.
You can also configure a fully offline setup using a local model. Since code parsing runs entirely on your machine, your source code never needs to leave your environment.
Benchmarks That Back Up the Hype
Let’s talk numbers, because hype is cheap.
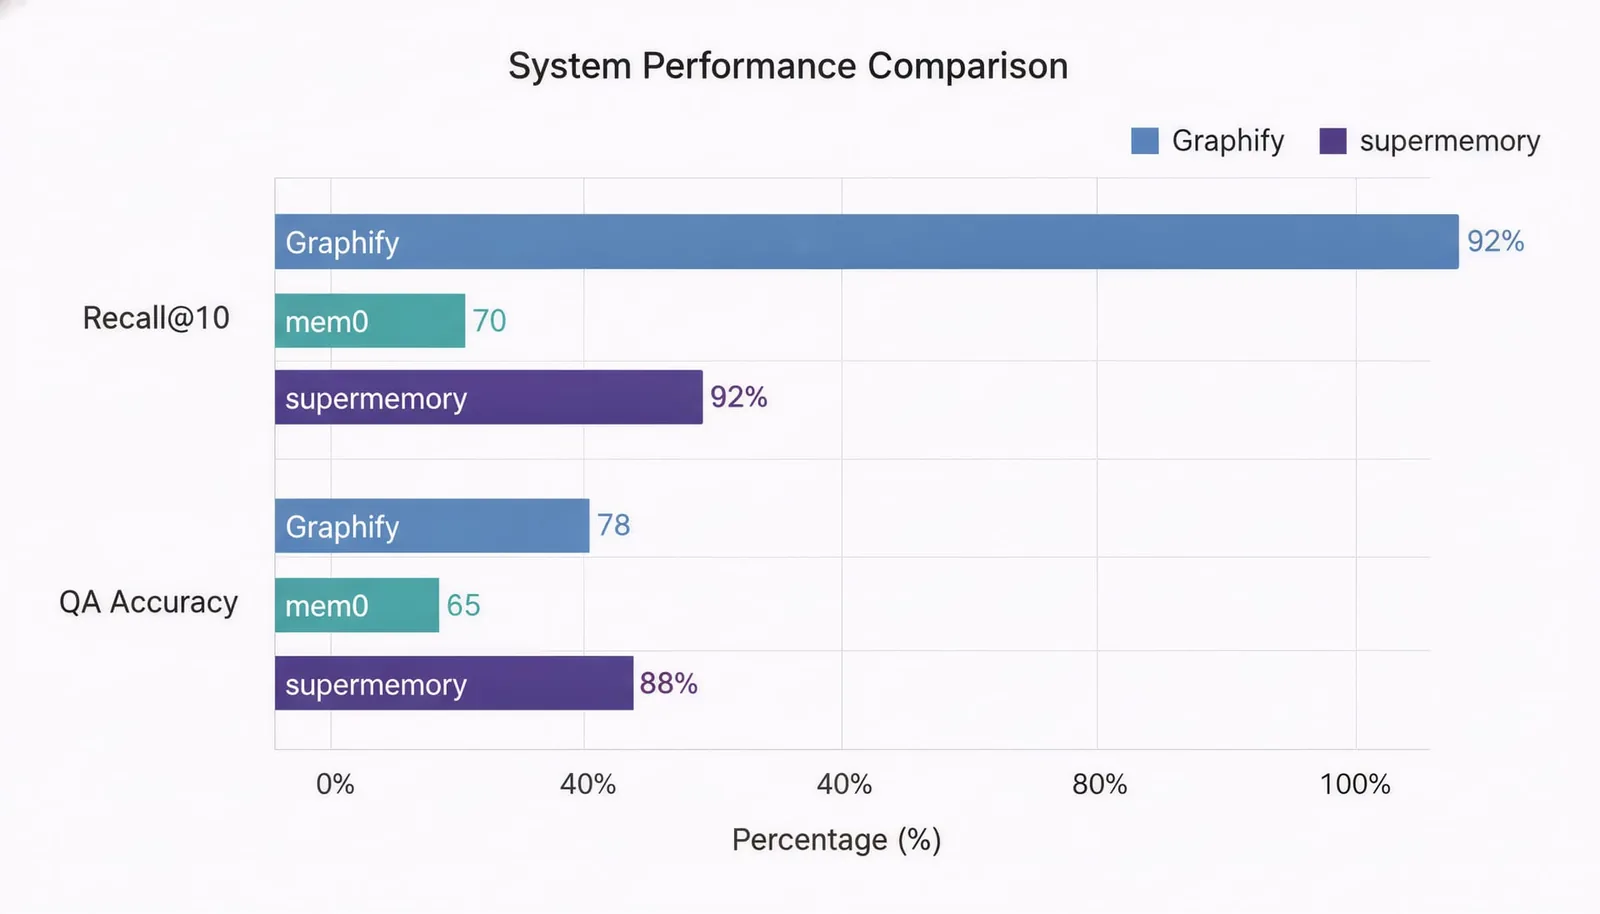
On the LOCOMO benchmark (n=300), Graphify achieves a recall@10 of 0.497. For comparison, mem0 gets 0.048, supermemory gets 0.149. That’s a 10x lead over mem0.
On QA accuracy, Graphify scores 45.3% on the same LOCOMO setting. supermemory edges ahead at 49.7%, but mem0 is at 27.3%. Not bad for a tool that spends zero LLM credits on code understanding.
On LongMemEval-S (n=50), Graphify ties with dense RAG at 76% QA accuracy.
The benchmark note that catches my eye: “Graph build LLM credits: 0 per-token for most systems.” Because code extraction is purely AST-based, you only pay for semantic extraction of non-code assets. If your project is mostly code, your cost is zero. Full stop.
These results come from a standard harness with a blind-judge validated against a second judge (90.6% agreement, Cohen’s kappa 0.81). The methodology is solid.
Extras That Show Serious Design Depth
The optional extras tell you a lot about where this project is heading. Beyond basic code and docs, you can add support for:
- PDF extraction (
graphifyy[pdf]) - Office documents —
.docxand.xlsxsupport (graphifyy[office]) - Google Sheets rendering (
graphifyy[google]) - Video/audio transcription using faster-whisper + yt-dlp (
graphifyy[video]) - MCP stdio server to integrate with MCP-compatible tools (
graphifyy[mcp]) - Neo4j push support (
graphifyy[neo4j]) - FalkorDB push support (
graphifyy[falkordb])
Each extra is optional, so you install only what you need. No bloat.
Should You Use It? My Honest Take
Yes, with one caveat.
If your project is tiny (under 20 files) and you know it inside out, Graphify is overkill. The overhead of building and querying a graph isn’t zero, even if it is small.
But for anything larger — a monorepo, a platform with multiple services, a project you haven’t touched in three months — Graphify is the fastest way I’ve found to build a mental model of a codebase. It doesn’t replace reading code. It replaces reading code blindly.
The community is active. The project is open source. The documentation is thorough. And the design philosophy — real graph, local first, transparency over magic — is exactly what the AI tooling space needs more of.
I recommend you do what I did: pick a project you’re vaguely familiar with, install Graphify, and run /graphify . just to see the graph. Then open graph.html and click around for five minutes. You’ll immediately see connections you hadn’t noticed.
Then ask yourself: what if I had this on every project I’ve ever inherited?